Execute savings without
The 14-Year, $15.7M Consulting Bill*
The supply-chain intelligence workspace built for hospitals replacing the seven-figure consulting cycle. Identify margins, generate supply-chain playbooks, and track execution velocity — without the retainer.
No consulting engagement.
Modeled savings opportunity of 1.2–2.0% of your annual supply and pharmacy spend. For a 250-bed hospital at the median spend per bed, that is $740K–$1.2M a year, against a $225,000 annual subscription. That figure covers supply and pharmacy only; the library's playbooks in other categories, such as Non-Clinical, IT, Capital Equipment & Construction and Facilities / Engineering, are modeled separately and are not included. Try the calculator
$900 per staffed bed, per year — the single published Strategic rate, $50,000 annual minimum. ROI Calculator
Zero-PHI by design — no patient data touches the platform
For the CFO & Finance
Stop waiting 6 months for a PowerPoint deck that tells you what you already know. Get a modeled savings pipeline sized from your own reported spend, with the Total Cost of Ownership (TCO) math done for you.
- Immediate Margin Visualization
- Savings Capture at Contract Close
- Zero Consulting Firm Overhead
For the Operational Executive
Execute faster than ever. No more building Excel files from scratch. We provide you with 300+ strategic initiative playbooks, strategy recommendations, and pre-built RFP (Request for Proposal) communication templates.
- Contract Hygiene Audit Algorithms
- Push-Button RFP / Memo Generator
- Built-in Kanban Project Management
THE 4-STEP PRODUCT
Run the Discovery Audit
Open the Playbook
Execute on the Kanban Board
Close the Loop
See It In Action
What you actually get.
Not a slide deck. Not a webinar. A live workspace your team logs into the same day they sign — already loaded with playbooks, dashboards, and execution tools.
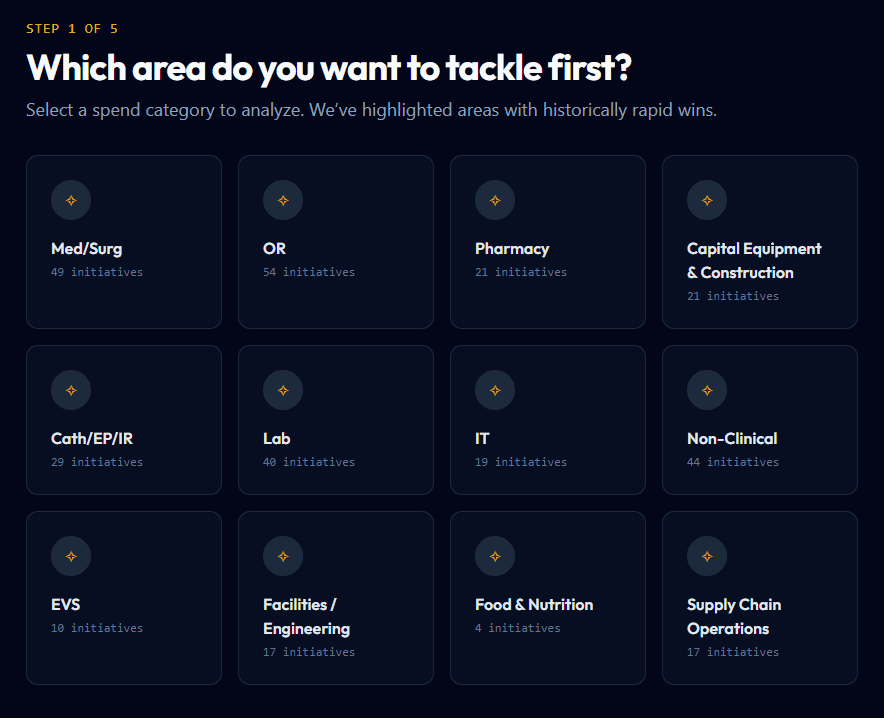
Discovery Audit Wizard
Select a spend category; see modeled savings ranges materialize in seconds across 300+ initiative playbooks spanning 12 hospital departments. No EHR integration, no IT approval.
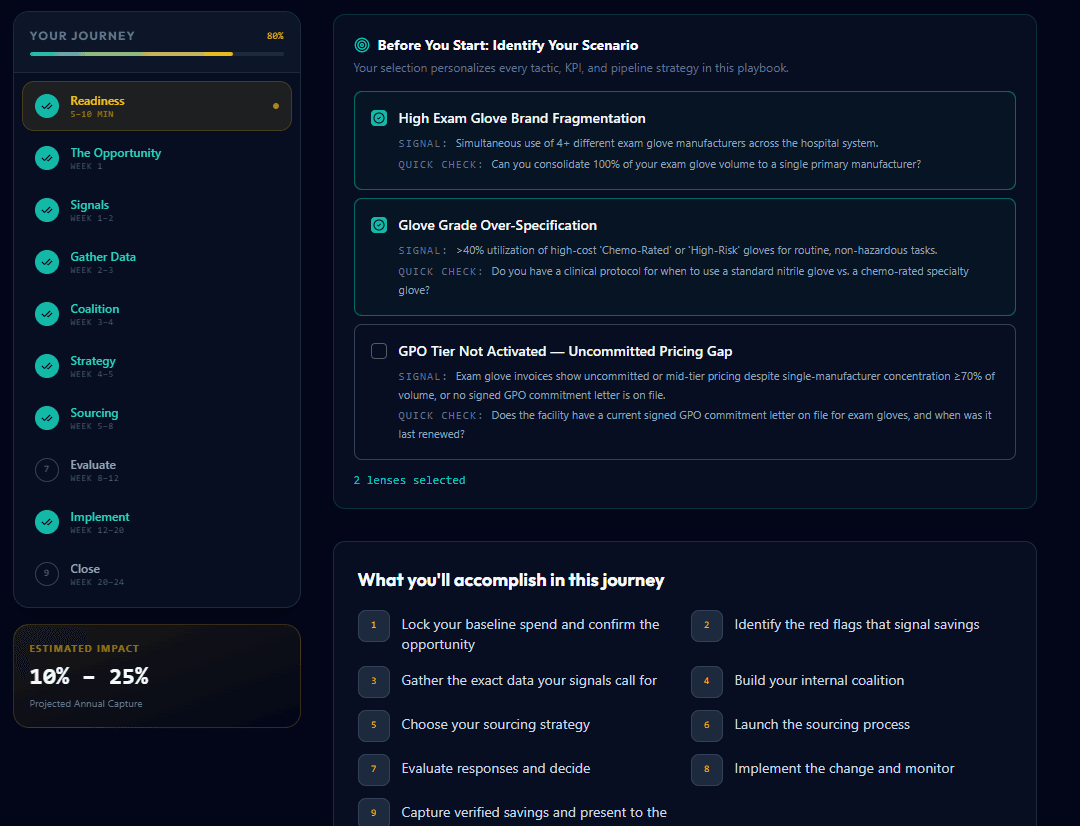
Playbooks
Step-by-step clinical and operational sourcing guides. Standardize spend categories using pre-authored vendor notices, RFP templates, stakeholder alignment maps, and downloadable executive charters.

Savings Pipeline Tracker
Identify, Strategize, Source, Contract, Validate. Kanban-style tracking for every active initiative and their current blocking status.
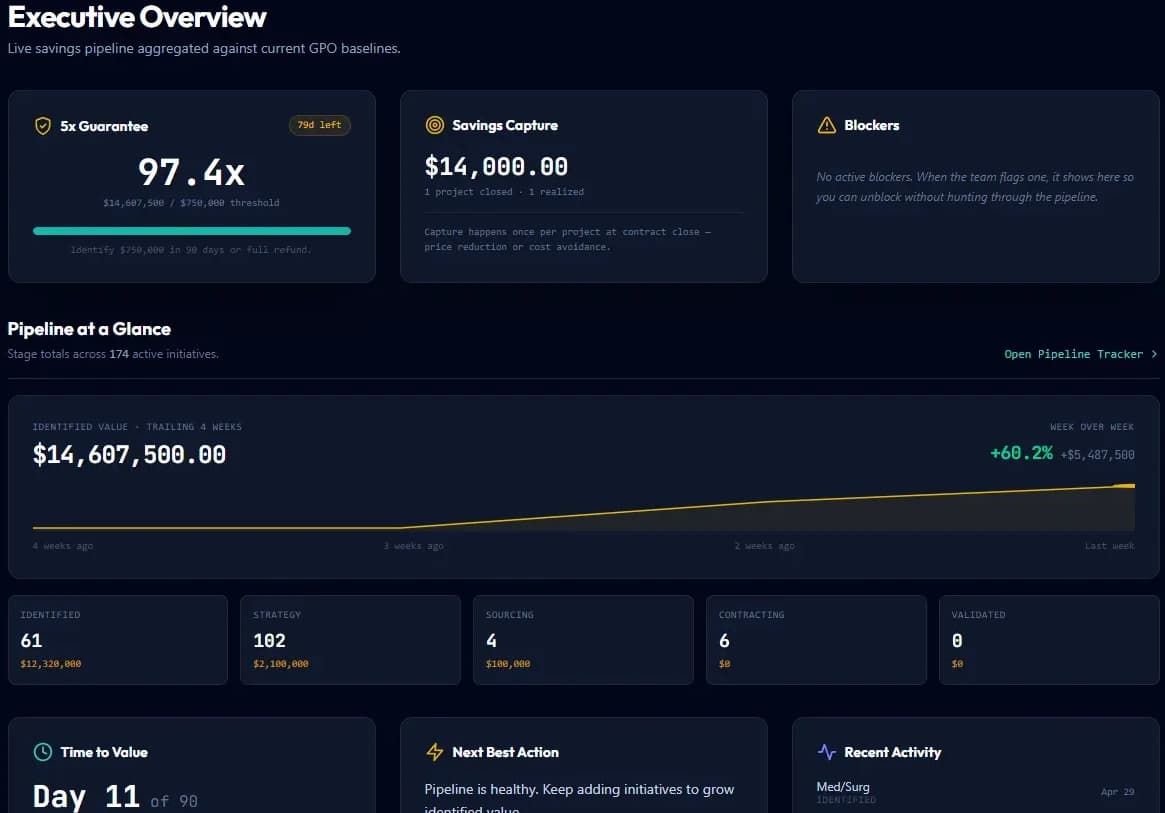
Executive Dashboard
The Savings Progress tracker, pipeline-at-a-glance chart, Time to Value, and next-best actions metrics — the view your CFO checks every Monday.
5 minutes · No credit card · Zero-PHI
Your Top Ranked Playbooks
Strategic-tier customers’ Discovery Audit identifies the top 3 high-impact playbooks tailored to their facility’s spend profile.
The ranking is guidance, not a requirement — activate any playbook in the library, in any order, at your own pace.
Sample Depth
See what a full playbook looks like.
3 initiatives are open to the public with IP sections redacted. They show the structure and depth every playbook follows.
Exam Gloves
The highest-volume commodity in your hospital.
Security Guard Services
The service contract where staffing assumptions go unchallenged.
Office Products
The back-office commodity nobody is watching.
Peer-Reviewed Evidence — JAMA, 2026
Old Model — Management Consulting
$15.7M cumulative per hospital across the 14-year study window (2009–2023)*
peer-reviewed · no measurable improvement
Average consulting spend per nonprofit hospital. JAMA studied 306 nonprofit hospitals vs. 513 matched controls over 2009–2023 and found no statistically significant improvements in finances, operations, or quality of care.
Hospital Focus CK Alternative
~80% less per year, at that bed count · $900/staffed bed/yr, not a multi-year consulting spend
- →300+ executable playbooks — your team runs them
- →At least 8 personalized initiative playbooks delivered within 90 days
- →Continuous platform — not a 30-slide diagnostic
See our delivery commitment for what we commit to and what happens if we fall short.
See the alternative →The Modern Standard of Execution
Why hospitals are ditching traditional consulting retainers for Hospital Focus CK.
Hospital Focus CK
The Workspace
Legacy Consultants
Traditional Consulting Engagement
The Institutional Memory Gap
What you execute, you own. What you don’t, we keep safe for your return.
When consultants leave, the playbook walks out the door with them. With Hospital Focus CK, every playbook your team executes becomes a permanent, downloadable asset — and the rest of your library stays warm in your cloud workspace, ready when you come back.
Questions before you run the numbers?
Source: Bruch JD et al. “Changes in Nonprofit Hospitals’ Finances, Operations, and Quality of Care After Using Management Consultants.” JAMA. 2026. Article 2848641. Hospital Focus CK is not affiliated with JAMA or the study authors. The $15.7M figure is the study’s average cumulative consulting spend per nonprofit hospital across its 14-year window (2009–2023); any per-engagement or cost-comparison figures shown are Hospital Focus CK estimates, not findings of the study. Individual results vary.